The prometheus configurations are below. Be sure to give the prometheus service account cluster permissions to GET nodes/proxy and nodes api endpoints.
Google cloud monitor only exposes a small subsection of cAdvisor metrics. With the setup below you’ll be able to collect all of the cAdvisor metrics from GKE. Here are the steps to directly query kubernetes to get cAdvisor metrics and the Prometheus configuration.
1. Create Service
To scrape the cAdvisor endpoint you’ll need to create a service account with cluster permissions to GET nodes/proxy and nodes.
Now that we are in the lets actually make a call api to kubernetes api get the cAdvisor Metrics. Run these individual commands.
# export the KSA bearer token to an env variable
export BEARER_TOKEN=$(cat /var/run/secrets/kubernetes.io/serviceaccount/token)

# Find the first K8s node
 export NODE_NAME=$(curl https://kubernetes.default.svc.cluster.local:443/api/v1/nodes/ -s -H "Authorization: Bearer $BEARER_TOKEN" -k | jq -r .items[0].metadata.name)

# Make an api call to kubernetes using curl
curl https://kubernetes.default.svc.cluster.local:443/api/v1/nodes/$NODE_NAME/proxy/metrics/cadvisor -H "Authorization: Bearer $BEARER_TOKEN" -k
After that you should see metrics for the node
# HELP machine_nvm_capacity NVM capacity value labeled by NVM mode (memory mode or app direct mode).
# TYPE machine_nvm_capacity gauge
machine_nvm_capacity{boot_id="bf88bcb1-f7dc-425d-87cc-ec4994216eb9",machine_id="b1962a4fef066daf20ce3f9adc1ca5e5",mode="app_direct_mode",system_uuid="b1962a4f-ef06-6daf-20ce-3f9adc1ca5e5"} 0
machine_nvm_capacity{boot_id="bf88bcb1-f7dc-425d-87cc-ec4994216eb9",machine_id="b1962a4fef066daf20ce3f9adc1ca5e5",mode="memory_mode",system_uuid="b1962a4f-ef06-6daf-20ce-3f9adc1ca5e5"} 0
GCP Horizontal Pod Autoscaling with Pub/Sub shouldn’t be as complicated as it is. I’m not sure why but following this GCP article it appears workload identity doesn’t work with the stack driver.
I instead did it the “old” way of using Google Service Accounts instead.
Assumptions
You already have a k8s cluster running.
You have kubectl installed and you are authenticated into your cluster
You have admin permissions with GKE to do the following
Create pub/sub topics & subscriptions
Create service accounts
Admin permissions inside of your k8s cluster
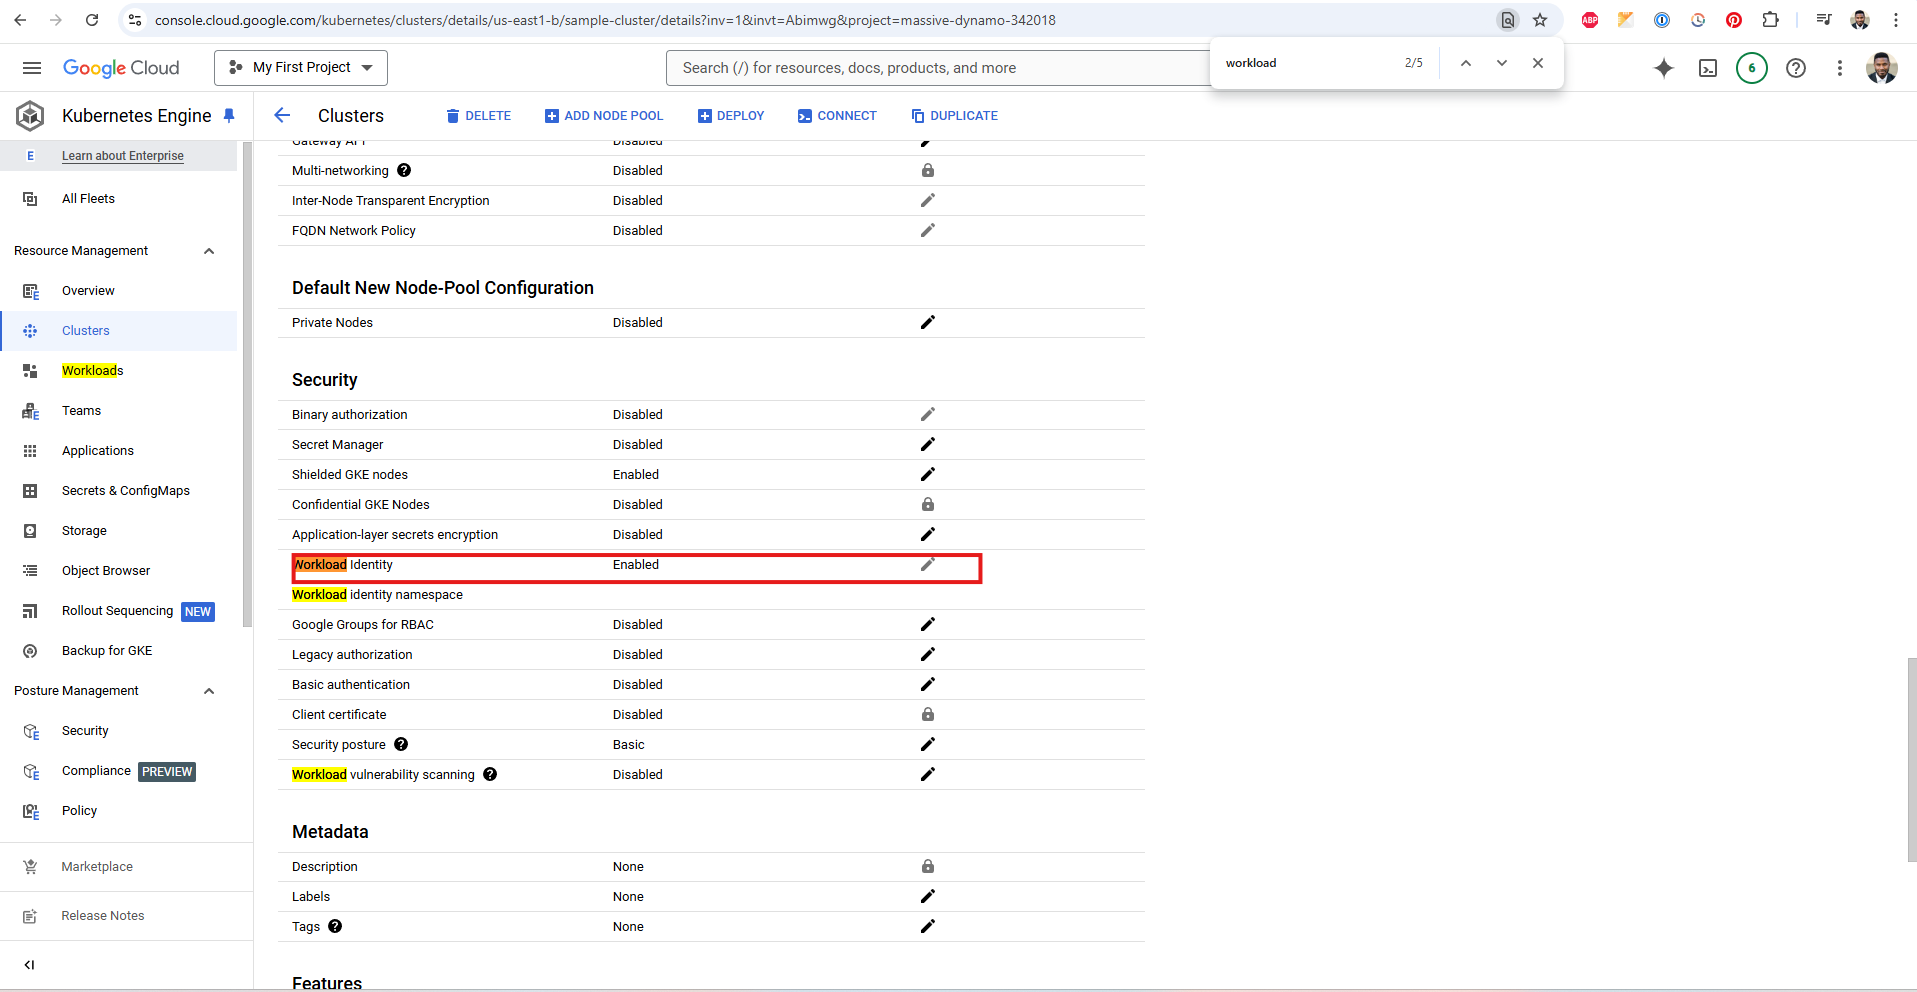
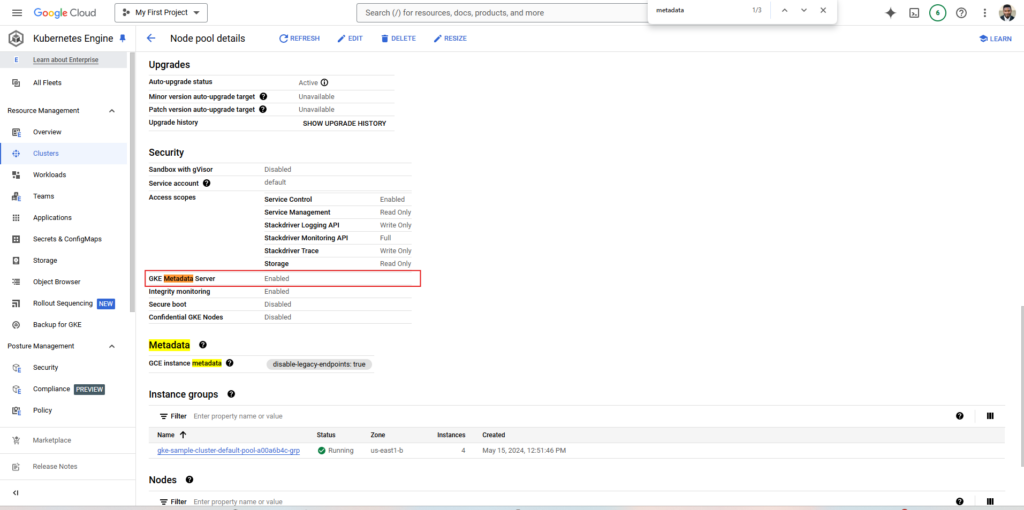
You already have workload identity turned on for BOTH you cluster and node pool
Cluster with workload identityNode Page with GKE Metadata Server enabled
If all the assumptions are true then your ready to run the script below. If not follow this guide GCP guide up until the “Deploying the Custom Metrics Adapter.”
Lets Get Down to HPA
First create a manifest file for a application and call the file test-app.yaml
This manifest will be called by the script below so make sure its in the working directory when you execute the script
import datetime
import time

# [START gke_pubsub_pull]
# [START container_pubsub_pull]
from google import auth
from google.cloud import pubsub_v1


def main():
    """Continuously pull messages from subsciption"""

    # read default project ID
    _, project_id = auth.default()
    subscription_id = 'echo-read'

    subscriber = pubsub_v1.SubscriberClient()
    subscription_path = subscriber.subscription_path(
        project_id, subscription_id)

    def callback(message: pubsub_v1.subscriber.message.Message) -> None:
        """Process received message"""
        print(f"Received message: ID={message.message_id} Data={message.data}")
        print(f"[{datetime.datetime.now()}] Processing: {message.message_id}")
        time.sleep(3)
        print(f"[{datetime.datetime.now()}] Processed: {message.message_id}")
        message.ack()

    streaming_pull_future = subscriber.subscribe(
        subscription_path, callback=callback)
    print(f"Pulling messages from {subscription_path}...")

    with subscriber:
        try:
            streaming_pull_future.result()
        except Exception as e:
            print(e)
# [END container_pubsub_pull]
# [END gke_pubsub_pull]


if __name__ == '__main__':
    main()
Next create bash script called run-example.sh
PROJECT_ID=$(gcloud projects list --filter="$(gcloud config get-value project)" --format="value(PROJECT_ID)")
SERVICE_ACCOUNT_NAME=custom-metrics-stackdriver
PROJECT_NUMBER=$(gcloud projects list --filter="$(gcloud config get-value project)" --format="value(PROJECT_NUMBER)")
EXAMPLE_NAMESPACE=default
PUBSUB_TOPIC=echo
PUBSUB_SUBSCRIPTION=echo-read

create (){

  kubectl apply -f https://raw.githubusercontent.com/GoogleCloudPlatform/k8s-stackdriver/master/custom-metrics-stackdriver-adapter/deploy/production/adapter_new_resource_model.yaml
  sleep 5
  kubectl apply -f https://raw.githubusercontent.com/GoogleCloudPlatform/k8s-stackdriver/master/custom-metrics-stackdriver-adapter/deploy/production/adapter_new_resource_model.yaml
  # running twice to make sure its being created
  echo "Created custom-metrics namespace and additional resources"

  gcloud iam service-accounts create $SERVICE_ACCOUNT_NAME \
    --description="custom metrics stackdriver" \
    --display-name="custom-metrics-stackdriver"
  echo "Created google service account(GSA) $SERVICE_ACCOUNT_NAME@$PROJECT_ID.iam.gserviceaccount.com"

  sleep 5 #Sleep is because iam policy binding fails sometimes if its used to soon after service account creation

  gcloud projects add-iam-policy-binding $PROJECT_ID \
   --role roles/monitoring.viewer \
   --member serviceAccount:$SERVICE_ACCOUNT_NAME@$PROJECT_ID.iam.gserviceaccount.com
  echo "added role monitoring.viewer to GSA $SERVICE_ACCOUNT_NAME@$PROJECT_ID.iam.gserviceaccount.com"

  gcloud iam service-accounts add-iam-policy-binding  \
    --role roles/iam.workloadIdentityUser \
    --member "serviceAccount:$PROJECT_ID.svc.id.goog[custom-metrics/custom-metrics-stackdriver-adapter]" \
    $SERVICE_ACCOUNT_NAME@$PROJECT_ID.iam.gserviceaccount.com
  echo "added iam policy for KSA custom-metrics-stackdriver-adapter"

  kubectl annotate serviceaccount --namespace custom-metrics \
    custom-metrics-stackdriver-adapter \
    iam.gke.io/gcp-service-account=$SERVICE_ACCOUNT_NAME@$PROJECT_ID.iam.gserviceaccount.com
  echo "annotated KSA custom-metrics-stackdriver-adapter with GSA $SERVICE_ACCOUNT_NAME@$PROJECT_ID.iam.gserviceaccount.com"

  gcloud pubsub topics create $PUBSUB_TOPIC
  sleep 5
  echo "Created Topic"

  gcloud pubsub subscriptions create $PUBSUB_SUBSCRIPTION --topic=$PUBSUB_TOPIC
  echo "Created Subscription to Topic"


  kubectl apply -f test-app.yaml -n $EXAMPLE_NAMESPACE
  echo "Deployed test application"

  gcloud projects add-iam-policy-binding projects/$PROJECT_ID \
    --role=roles/pubsub.subscriber \
    --member=principal://iam.googleapis.com/projects/$PROJECT_NUMBER/locations/global/workloadIdentityPools/$PROJECT_ID.svc.id.goog/subject/ns/$EXAMPLE_NAMESPACE/sa/pubsub-sa
  echo "Added workload identity to to pubsub-sa"
}

delete() {
  kubectl delete -f test-app.yaml -n $EXAMPLE_NAMESPACE
  kubectl delete -f https://raw.githubusercontent.com/GoogleCloudPlatform/k8s-stackdriver/master/custom-metrics-stackdriver-adapter/deploy/production/adapter_new_resource_model.yaml

  echo  $SERVICE_ACCOUNT_NAME@$PROJECT_ID.iam.gserviceaccount.com
  gcloud iam service-accounts delete $SERVICE_ACCOUNT_NAME@$PROJECT_ID.iam.gserviceaccount.com --quiet

  gcloud projects remove-iam-policy-binding projects/$PROJECT_ID \
      --role=roles/pubsub.subscriber \
      --member=principal://iam.googleapis.com/projects/$PROJECT_NUMBER/locations/global/workloadIdentityPools/$PROJECT_ID.svc.id.goog/subject/ns/$EXAMPLE_NAMESPACE/sa/pubsub-sa

  gcloud pubsub topics delete $PUBSUB_TOPIC
  gcloud pubsub subscriptions delete $PUBSUB_SUBSCRIPTION
}

create
If you are prompted to enter a condition choose “None”
Confirm Application is Working
Make the application pod is running
$ kubectl get pods

NAME                      READY   STATUS    RESTARTS   AGE
pubsub-7f44cf5977-rbztk   1/1     Running   0          16h
Make sure the hpa is running
$ kubectl get pods
NAME     REFERENCE           TARGETS         MINPODS   MAXPODS   REPLICAS   AGE
pubsub   Deployment/pubsub   0/2 (avg)   1         4         1          1m
Lets trigger an auto-scale event by sending messages to the echo topic.
for i in {1..200}; do gcloud pubsub topics publish echo --message="Autoscaling #${i}"; done
It’ll take 2-5 minutes for the scaling event to occur. Yes this is slow.
After awhile you should see that the pod number has increased and that is reflected on the hpa status as well
$ kubectl get hpa

NAME     REFERENCE           TARGETS     MINPODS   MAXPODS   REPLICAS   AGE
pubsub   Deployment/pubsub   25/2 (avg)   1         4         4          74m


$ kubectl get pods

NAME                      READY   STATUS        RESTARTS         AGE
pubsub-7f44cf5977-f54hc   1/1     Running       0                25s
pubsub-7f44cf5977-gjbsh   1/1     Running       0                25s
pubsub-7f44cf5977-n7ttr   1/1     Running       0                25s
pubsub-7f44cf5977-xglct   1/1     Running       0                26s
Troubleshooting
Always check the output of run-example.sh first. Odds are you didn’t have permissions to do something. You can always run the delete command and start all over
***NOTE: you’ll need to change the name of the service account because GCP does soft deletes on service accounts.
Problems
HPA has unknown under targets.
$kubectl get hpa

NAME     REFERENCE           TARGETS         MINPODS   MAXPODS   REPLICAS   AGE
pubsub   Deployment/pubsub   unknown/2 (avg)   1         4         4          64m
The reason for this is that some configuration just went wrong. Check to make sure every command executed correctly.
You can even check the logs from the custom-metrics pod to make sure nothing is wrong.
austin.poole@docker-and-such:~$ kubectl get pods -n custom-metrics
NAME                                                 READY   STATUS    RESTARTS   AGE
custom-metrics-stackdriver-adapter-89fdf8645-bbn4l   1/1     Running   0          5h11m
austin.poole@docker-and-such:~$ kubectl logs custom-metrics-stackdriver-adapter-89fdf8645-bbn4l -n custom-metrics
I1127 13:52:25.333064       1 adapter.go:217] serverOptions: {true true true true false   false false}
I1127 13:52:25.336266       1 adapter.go:227] ListFullCustomMetrics is disabled, which would only list 1 metric resource to reduce memory usage. Add --list-full-custom-metrics to list full metric resources for debugging.
I1127 13:52:29.127164       1 serving.go:374] Generated self-signed cert (apiserver.local.config/certificates/apiserver.crt, apiserver.local.config/certificates/apiserver.key)
....
Make sure that the external metrics APIService exists by querying the api-server.